从[Problem] 求推荐一款数据分析绘图软件继续讨论:
Vega-lite 本质上是 JSON 文件,在 Emacs 中可以用自带的 json-mode 编辑。想要䃼全的话可以用 eglot 配合 vscode-json-languageserver - npm 使用,注意需要有 yasnippet 才会开启䃼全。
JSON lsp server 读取到
"$schema": "https://vega.github.io/schema/vega-lite/v5.json"
后会自功下载 JSON Schema 提供䃼全,你也可以把 Schema 下到本地把 URL 替成本地文件。
对于不想在 macOS 上装 nodejs 和 npm 的用户,可以用 GitHub - zed-industries/json-language-server ,记得把 binary 重命名成 vscode-json-language-server
Vega lite 可以在浏览器中加載 JS 使用,也可用 npm 或 yarn 安装 vega-lite 使用命令行生成 PDF/SVG。
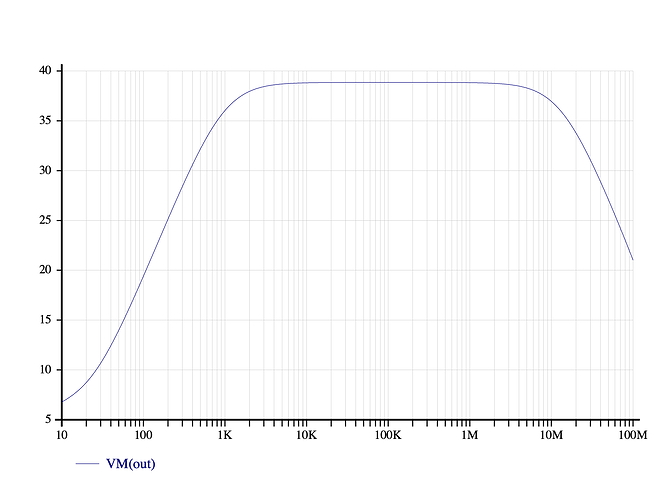
下面是用从 gnucap 生成的 ac frequency response 的演示,
Vega lite source
{
    "$schema": "https://vega.github.io/schema/vega-lite/v5.json",
    "data": {"url": "bode.tsv",
             "format": {"type": "tsv"}},
    "transform": [{"calculate": "20*log(100*datum['VM(out)'])/LN10",
                   "as": "gain"}],
    "mark": {
        "type": "line",
        "interpolate": "natural",
        "strokeWidth": 1
    },
    "encoding": {
        "x": {
            "field": "Freq",
            "scale": {"type": "log"},
            "title": "Frequency (Hz)",
            "axis": {"format": "~s"}
        },
        "y": {
            "field": "gain",
            "type": "quantitative",
            "title": "Gain (dB)"
        }
    },
    "width": 600,
    "height": 400
}
Vega lite source
{
    "$schema": "https://vega.github.io/schema/vega-lite/v5.json",
    "data": {"url": "data.tsv",
             "format": {"type": "tsv"}},
    "repeat": {
        "layer": ["V(in)", "V(out)", "p(Vcc)" ]
    },
    "spec": {
        "mark": {
            "type": "line",
            "interpolate": "natural",
            "strokeWidth": 1
        },
        "encoding": {
            "x": {
                "field": "Time",
                "type": "quantitative",
                "title":"Time (s)"
            },
            "y": {
                "field": {"repeat": "layer"},
                "type": "quantitative",
                "title": null
            },
            "color": {
                "datum": {"repeat": "layer"},
                "type": "nominal"
            }
        },
        "width": 600,
        "height": 400
    }
}
我用 TECO 写了个脚本把 gnucap 的输出格式转成合法的 TSV。
! Assume buffer content is the file name without extension !

0,128ET      ! Abort on error !

EO - 200 "L
    @^A/Macro requires TECO version 200+/ 13^T 10^T ^C
'
Z            !! Error if no file name
"E
    :@^A/Specify file name with --text or -T option/ ^C
'
hXa bJ       !! copy to @A
@FS/.txt/.tsv/ !! Replace the file extension
hXb hK       !! save to @B
@EW/^EQb/    !! specify write to file.tsv
@ER/^EQa/ Y  !! read from file.txt

0J
<.-Z;   !! Exit if is last of the line
DL-2CDL !! Remove leading and trailing spaces
>

0J<@FS/ /	/;>  !! Replace space to tab

EX  ! bye !
^[^[
