我用 pandas 绘图的时候遇到一个 bug,就在 pandas 的 issue 列表里问开发者进展,然后一个 Contributor 问我有没有兴趣解决这个问题,而且还非常贴心地把可能出问题的地方给我指出来了。哈,我当然想解决,但是我 python 只限于作为脚本语言,没有搞过复杂的开发,所以就想来论坛求助一下,看看大家的意见。
opened 02:40PM - 22 Dec 16 UTC
closed 09:33PM - 04 Jan 20 UTC
Bug
Visualization
#### Code Sample, a copy-pastable example if possible
```python
# Your code … here
import numpy as np
import pandas as pd
import matplotlib.pyplot as plt
df = pd.DataFrame(np.random.randn(8, 3),
columns=['A', 'B', 'C'])
ax = df.plot (y=['A'], marker='x', linestyle='solid')
df.plot (y=['B'], marker='o', linestyle='dotted', ax=ax)
df.plot (y=['C'], marker='<', linestyle='dotted', ax=ax)
plt.grid()
plt.show()
```
#### Problem description
The legend is missing some markers.
If I add
plt.legend()
then they show up.
See attached
[figure1.pdf](https://github.com/pandas-dev/pandas/files/668980/figure1.pdf)
[this should explain **why** the current behaviour is a problem and why the expected output is a better solution.]
#### Expected Output
#### Output of ``pd.show_versions()``
<details>
# Paste the output here pd.show_versions() here
INSTALLED VERSIONS
------------------
commit: None
python: 3.5.2.final.0
python-bits: 64
OS: Linux
OS-release: 4.8.14-300.fc25.x86_64
machine: x86_64
processor: x86_64
byteorder: little
LC_ALL: None
LANG: en_US.UTF-8
LOCALE: en_US.UTF-8
pandas: 0.19.1
nose: 1.3.7
pip: 9.0.1
setuptools: 31.0.0
Cython: 0.25.2
numpy: 1.12.0rc1
scipy: 0.18.1
statsmodels: None
xarray: None
IPython: 5.1.0
sphinx: 1.5
patsy: None
dateutil: 2.6.0
pytz: 2016.10
blosc: None
bottleneck: None
tables: 3.3.0
numexpr: 2.6.1
matplotlib: 2.0.0rc2
openpyxl: None
xlrd: None
xlwt: None
xlsxwriter: None
lxml: None
bs4: 4.5.1
html5lib: 0.999
httplib2: None
apiclient: None
sqlalchemy: None
pymysql: None
psycopg2: None
jinja2: 2.8
boto: None
pandas_datareader: None
</details>
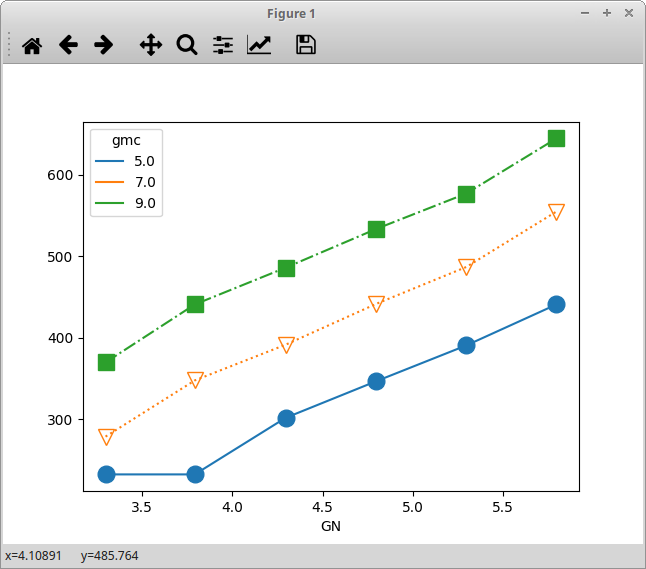
这个 bug 可以用下面这个图来说明,就是 pandas dataframe 绘制一系列曲线的时候,注意左上角的图例(legend)中的线型可以正常显示,但是标记(marker)不能显示:
趁此机会粗浅了解了下 pandas。这是我修改后的那位楼主的代码:
import numpy as np
import pandas as pd
import matplotlib.pyplot as plt

df = pd.DataFrame(np.random.randn(8, 3),
                  columns=['A', 'B', 'C'])
ax = df.plot (y='A', marker='x', linestyle='solid')
df.plot (y='B', marker='o', linestyle='dotted', ax=ax, subplots=True)
df.plot (y='C', marker='<', linestyle='dotted', ax=ax, subplots=True)
plt.grid()
plt.show()
y=‘A’ 处不应该用 [‘A’] 这种形式,否则会触发
UserWarning: Pandas doesn't allow columns to be created via a new attribute name - see https://pandas.pydata.org/pandas-docs/stable/indexing.html#attribute-access 的警告。
另一个问题,大略感觉是 subplots 那判断有问题,也懒的去深究 pandas 源代码。于是强行给它加上 True,然后就好使了。。。
你要有空就仔细读一下 pandas 源码,如果确实是 subplots 判断有问题,那就提个 PR。
1 个赞